Simulating the Negative Consequences of Multitasking on Flow, Throughput, and Value Generation
A simple simulation makes the multitasking madness observable at a glance and what to do about it.
Quite recently, I had the chance to talk about the disastrous consequences of starting work too soon when it comes to product development. I’ve said that starting work too early is the root of all evil. And although this might have been exaggerated to some extent, I wanted to make the point that beginning work too soon leads to multitasking, and multitasking leads to loss of responsiveness and throughput, which ultimately leads to reduced value generation. (If you want to read the transcript of the talk, you find it here.)
At this talk, I’ve presented simulation-generated charts illustrating the massively adverse effects of starting work too soon. Those charts intrigued some of the audiences, which made me confident to show them to you and give some context on how those charts have been derived and how you can use simulation to shed light on the effects described above.
Starting too soon leads to multitasking with unintended consequences

The multitasking effects
As you’ve seen in the charts above, multitasking has severe consequences for the overall throughput of a delivery system (like product development or service desk work). Just let us dive a bit deeper to reveal the full impact of multitasking based on a simple simulation.
If you want to understand the simulation itself better, you will find a detailed description, a video, and a chance to play around with that simulation in the last part of that post.
Starting too soon creates a high starting responsiveness.
First, let’s take a look at one reason why it’s so tempting to multitask? The simulation reveals that if a team does single-tasking, saying “no” to opportunities, they miss opportunities quickly. This simulation presented here takes into consideration that ideas have an expiration date. As soon as the window of opportunity closes, the concept loses relevance, and the work item is terminated (maybe a stakeholder no longer asks for the work item or the season for that feature is over). The simulation counts this as a “drop” of a work item. However, this termination will only be recognized if the work on that item has not started already.
Take a look at the following simulation result.

You notice quickly that the teams that multitask can start with several work items in a very short time. In other words, they don’t have to say “no” to the opportunities. I’m pretty sure that this makes a lot of people happy in the real world. That’s why no opportunity is missed for 74 days, and the teams that single-task miss their first opportunities after 14 days.
From a perspective of “starting responsiveness”, the multitask teams seem to have an advantage here. However, the tide turns on day 75. In the simulation, we assume that the teams at some point can no longer handle additional work items. This means that even the teams that perform multitasking have to stop starting more work items at some point since they are entirely overloaded by then. And that is the point where the multitasking teams lose almost every opportunity because they are super loaded and busy trying to finish the work they have started already. The single-tasking teams also lose opportunities (the simulation is realistically configured so that there are more opportunities than the teams can handle). Nevertheless, these teams remain responsive and have a fair chance of seizing opportunities by the hand as they emerge.
Starting too soon creates a low delivery responsiveness
Although starting soon seems to be more responsive at first glance, it ultimately isn’t when it comes to finishing work.

While the teams that single-task create a constant stream of finished work items, the teams that multitask hardly finish anything over a long period. When these teams finish work, they do it in larger batches than the single-tasking teams. I don’t want to discuss the consequences of large delivery batches in this post. However, you might want to keep in mind that they bear a cost.
From a perspective of delivery responsiveness, the single-tasking teams perform superior. Interestingly, the responsiveness of starting new work is usually valued highly in organizations, making it even harder to resist starting new work before it gets finished.
So although multitasking seems superior from a perspective of starting work, which is usually highly rewarded in organizations, teams quickly lose their ability to react to changing user demands since they are completely busy with all the work stat they promisingly have started already. Single-tasking teams have to strictly say “no” to starting new work all the time when there is already work in process. Although this may not be highly rewarded by people putting demand onto those teams, in the long run, those single-tasking teams are highly responsive when it comes to new demands.
Ok, if you say, “Well, yes, that was one run of the simulation, but if the needed process time per work item is randomly distributed, how does it look next time?” I’ve run 25 simulations for single-tasking and multitasking to compare those two approaches.

You might recognize that the results of those 25 runs produce interesting patterns for the output of those teams. Although due to the randomness of the process times, there is variation in the output, the single-tasking teams reliably deliver more with seemingly high reliability.
You are also free to play around with the simulation by yourself.
Starting too soon destroys value
Suppose we further assume that every work item has a particular, randomly lognormal distributed value that it can create per day (e.g., revenue per day), and we randomly pick which work item we start working on. In that case, we can simulate the effect of multitasking and single-tasking on value generation from the organization’s perspective.

The effect is astonishing. Although single-tasking doesn’t seem to be as responsive as multitasking at first glance, it generates value much faster. In this idealized simulation, the single-tasking teams generate 21 times the value than the multitasking teams. Looking at real organizations with real people might be overly optimistic; nevertheless, single-tasking positively impacts the overall value generation.
Starting too soon creates unpredictability
Often predictability is desperately missed in modern product development work. “When will it be done?” is still one of the most frequently asked questions when talking to teams. Many teams and product managers surrendered to the so-called VUCA world, and they assumed that the world of product development is entirely unpredictable. And while this might be true to some extent when it comes to the complexity of social or economic systems, it certainly is not valid for the delivery part of product development. However, if we measure our teams’ delivery times (Lead Times or Flow Times), we could easily assume it is an entirely unpredictable process.
Very often, we don’t know when started work will be done. Contemporary management approaches try tackling that assumed unpredictability by planning excessively and tighter monitoring.
But what if the uncertainty in product delivery is not the cause for the unpredictable delivery times but the symptom of something else? Looking at the charts below, you might recognize that the Flow Times (time from starting a work item to finishing it) for each work item is much more predictable for the single-tasking teams. In contrast, it looks almost arbitrary for multitasking teams.

The simulation is built so that the actual time it takes for each work item to be finished varies randomly (lognormal distribution). This means some work items need only a little time to be done, and some need a lot of effort. And although this actual effort required is randomly distributed for both the single-tasking teams and the multitasking teams, we recognize that the Flow Time is pretty stable, around 10 to 20 days for all the work items. In comparison, the Flow time for the multitasking team varies drastically from 20 days to more than 300 days.
“Your process is unpredictable. What you may not realize, though, is that you are the one responsible for making it that way.” Daniel Vacanty *
So while contemporary management approaches try to plan the flow of work itself, it seems to be more effective to stop the planning and alter the restrictions in which the product delivery work is performed. Reducing the number of parallel work items and allowing Pull- (starting work as soon as capacity is available) instead of Push-mechanics (starting work as soon as the work is waiting) effectively brings back predictability to your delivery process. If the preconditions for product development change, it is more effective to measure the Flow Times (from starting a work item to finishing it) to answer the omnipresent question of “When will it be done?”.
Starting too soon generates waiting times
The effects described above — the reduced throughput, the reduced value generation, and the unpredictability — result from the excessive introduction of Waiting Time into the value generation process if you start work too early.
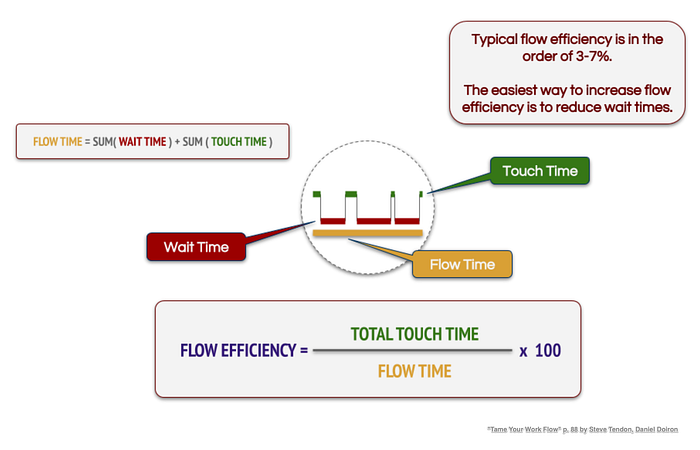
The lean and agile folks express the ratio of value-adding and non-value-adding time in terms of Flow Efficiency. The ratio of the total value-adding Touch Time and the Flow Time, which includes the Touch Time and the non-value-adding Waiting Time, is the Flow Efficiency.
Without going into any details, let’s assume that a higher Flow Efficiency is favorable over a low Flow Efficiency since it is less wasteful in terms of effective use of available team time.
If you look at the simulation results below, you can immediately spot that single-tasking yields a higher Flow Efficiency in the long run. This leads to more efficient use of available team time and thus much higher throughput.

Summary of the simulation results
Although highly simplified, the simulation reveals the harmful effects of starting work too early. Starting work too early leads to multitasking which has disastrous consequences on throughput, value generation, and predictability.
Minimizing the amount of work in process and using Pull instead of Push are effective counter-measures to multitasking and significantly impact the productivity of product development teams.
Those counter-measures are usually under the team’s control, although it may not seem that way at first glance. Suppose a team may feel the Push of starting work prematurely because of “outside pressure”. In that case, this simulation may help make the dire consequences explicit and reduce the pressure put on product development teams.
Feel free to play around with the simulation and witness the boundary conditions effects (Push vs. Pull, WIP Limits).
Why simulations?
Delivering great value to customers while simultaneously achieving joy, satisfaction, and flow at work is something that I want to support in my profession. Unfortunately, the prerequisites for this kind of work environment are pretty demanding. More often than not, I’ve struggled to generate the understanding and the willingness to create the necessary preconditions for this work environment. I often thought that people don’t understand the full magnitude of their decisions, for instance, when releasing work too early into the value delivery system.
Feedback cycles in real-life situations are often too long to effectively learn from them. Even if you have fast feedback cycles, organizations, by their nature, are not an excellent place for well-designed experiments where you can immediately see and compare the effects of your decisions.
Although often rather primitive, simulations may help us overcome those obstacles and support fast-paced learning.
The following video displays the simulation in action. Five single-tasking teams and five multitasking teams try to burn 100 work items. I find it interesting to see the real-world patterns of dealing with work becoming revealed too clearly in a simple simulation.
If you want to play around with the simulation yourself, feel free to check out the simulation here.
The simulation setting
If you want to dive deeper into the simulation itself, you might want to read on. I will describe the setup of the simulation and its underlying assumptions.
The basic mechanics
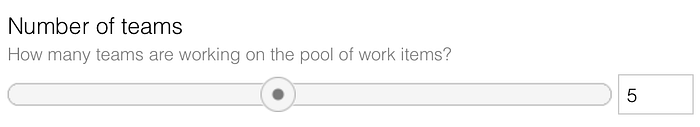
Let’s begin super simple. Imagine five teams that share a pool of work items.

Any of those teams can work on each work item. There is no specialization considered in this simulation. And there are no dependencies between the teams. A single team can finish each work item. I’ve renounced dependencies between teams to keep the simulation easy to use for this blog post, although I know how common they are in scaled product development. If you want to see the effects of multitasking in a world full of dependencies, take a look at this blog post.

You may want to play around with the number of teams. However, consider that the simulation software used for this particular simulation is browser-based, which means your browser has to run all the calculations for the simulation in real-time on your machine. If you have many teams and loads of work items in the simulation, your device may slow down.
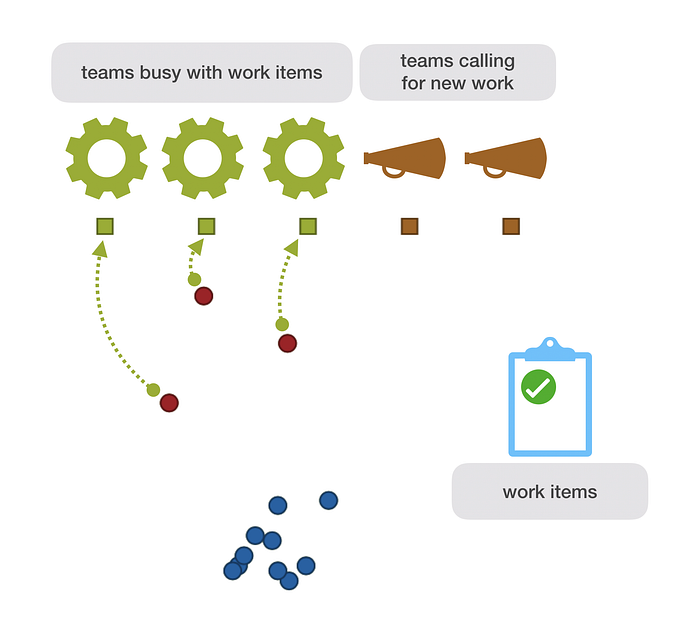
In this simulation, each time can have the state of being busy or being called for a work item.
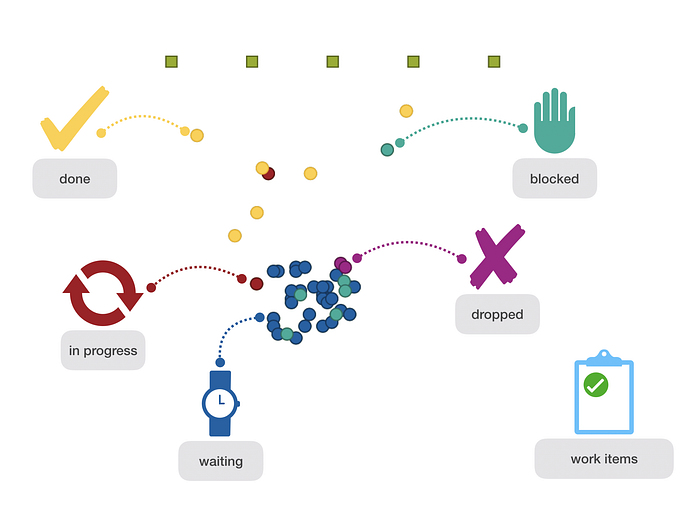
Each work item can be waiting, in progress, blocked (means started but currently not worked on), done, or dropped.
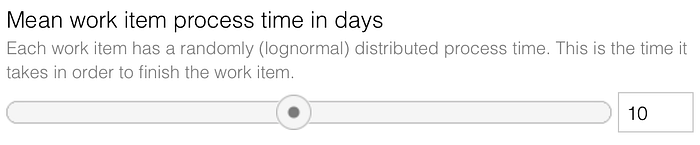
The work items need a certain amount of effort to be finished. This effort is randomly calculated (lognormal distribution around the mean effort per work item) for each work item. The simulation emulates 365 days of a year (yes, we usually don’t work on weekends). Every day when a work item is in progress, this day is subtracted from the needed effort of this work item as soon as the work is completed and we’ve spent enough progress time on a work item to fulfill the required amount of work the work item is marked as done.
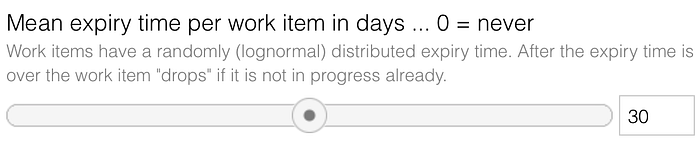
Every work item has a randomly assigned expiry time (lognormal distribution around the mean expiry date). Every day a work item is waiting to be worked on, the expiry time is reduced by this one day. After consuming the whole expiry time, the work item “drops”. When a work item is dropped, it can no longer be worked on. Think about it as a missed opportunity.
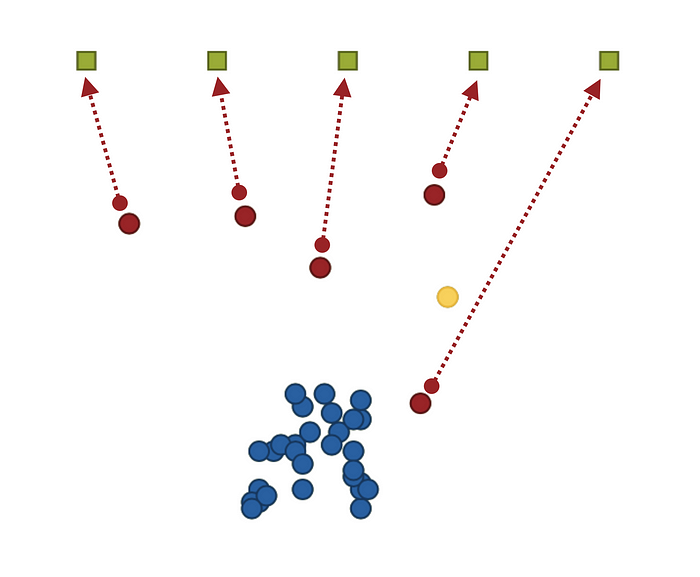
As soon as it gets worked on, each work item is associated with a particular team. This is true whether this work item is pulled by the team or pushed onto the team. The work item steadily moves toward its associated team to make this relation explicit. However, the work item may only move if it is in progress.
New work items join the pool of already waiting work items from time to time. Initially, the spawn rate is configured so that there should always be a work item to work on even if work items drop from time to time.

Push and Pull
The simulation’s heart is the possibility of making the effects visible of pushing work into a system faster than the system can process this work.
“The principle remains the same: any time you try to shove items into a system at a faster rate than items can exit the system, you are met with disastrous consequences. This principle seems immediately obvious and intuitive. Yet, for whatever reason, we constantly ignore this rule when we manage knowledge work.” Daniel Vacanti *
You may seemingly adjust at which probability a work item waiting to be processed may be pushed onto one of the teams.
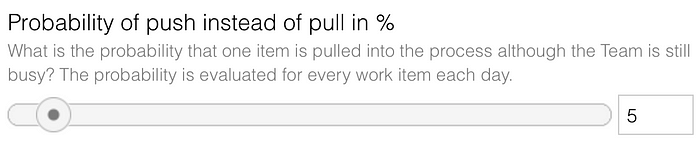
The single-tasking teams don’t accept any Push, and that’s why the probability is zero percent. It is fun to play around with the simulation and see the effects on predictability and throughput emerge from a high degree of Push.
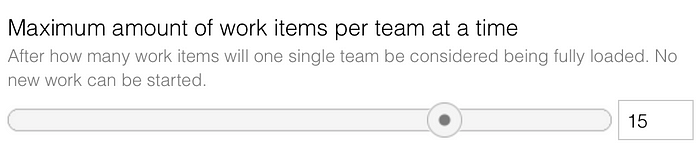
Overload work in progress limit
Even if the workflow for the teams is based on Push instead of Pull, the simulation acknowledges that you cannot push work onto teams indefinitely. At some point, the team can no longer start new work. Although this is not a work in progress limit in its original sense, it somehow limits each team’s maximum amount of work in progress.
The underlying assumptions
Even if a team works in multitasking mode, it can only work on one work item at a time since we assume that the team’s full knowledge is needed to make progress on that work item. (We may argue about this restriction in the simulation.) If a work item gets started, but then another work item receives the team’s attention, the former becomes “blocked”. You could also call it Waiting Time again, but I wanted to clarify that the work item really is blocked from its progress, and I didn’t want to confuse the different Waiting Times within this simulation.
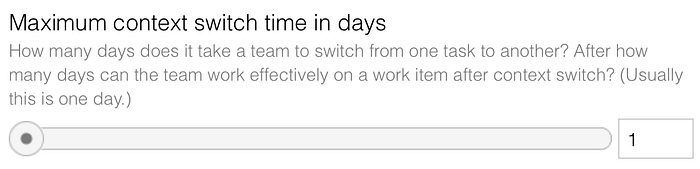
Multitasking bears the often hidden cost of Context Switching Time, and this is a non-productive time between switching from one unfinished work item to another. The simulation considers this Context Switching Time when a team changes from one work item to another to be more realistic. The initial configuration assumes that it drains one day of the team’s capacity if it shuffles work items.
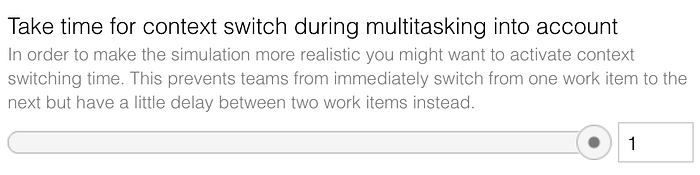
However, I know that not every work item switch costs a whole day to adjust to the new work item. That’s why this Context Switch Time only kicks in with a certain probability. You may play around with the different probabilities and see their effects.
The simulation results
I think it’s fun to see the simulation in action and look at all the work items flying around, but the real benefit of this simulation comes from the graphs plotted while running the simulation.

Since I’ve talked about the most relevant charts at the beginning of this post, I am not going deeper into those. Let the simulation run and see the different graphs become plotted in real-time.
Insightmaker.com offers some documentation on how to run a simulation. If you want to see how results change if you run many rounds (comparable to Monte Carlo simulation), you may wish to use sensitivity testing in insight maker.
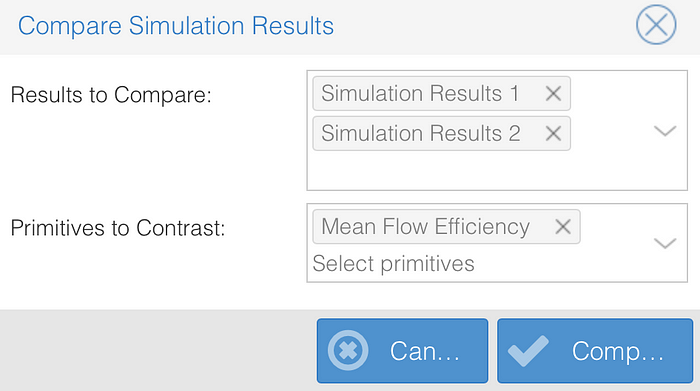
I highly recommend the “compare results” feature of insightmaker.com.
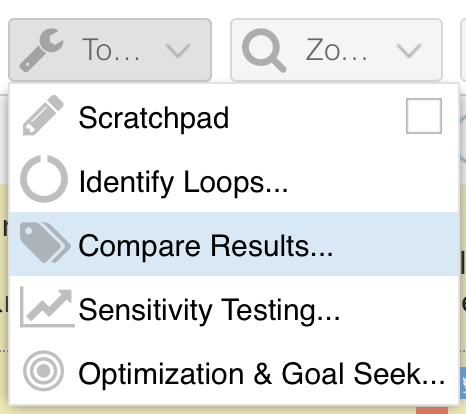
If you run more than one simulation, you can compare specific results with each other.
I got you covered if you want to look at the raw simulation results data. Download the compressed file here.
Final words
I hope that this simulation makes the effects of starting work too soon more accessible and understandable. You may have as much fun as I have when playing around with the simulation, and maybe it helps you communicate the necessity of saying “no” to your colleagues.
Hopefully, this simulation encourages you to give work in progress limits and single-tasking a try, which may ultimately lead to more productive and joyful work.
If you have questions regarding this simulation, feel free to leave a reply or get in touch on Twitter.